
Google Analytics 4 (GA4) ushers in a new era of web analytics, markedly different from its predecessor, Universal Analytics. GA4 provides a comprehensive view of customer data across platforms, a crucial feature in today’s fragmented digital landscape.
However, recent polls show that a significant uptake lag has followed the release of GA4, with a mere 23% of marketers having switched to GA4 — despite the looming necessity of its adoption. Because of these impending changes, professionals must understand the differences in critical metrics and adapt quickly.
Adapting to GA4 requires understanding its unique KPIs, which are vital for tracking website performance and user interactions. This transition represents a fundamental change in tracking methodology. The introduction of new metrics and the deprecation of others necessitate a strategic approach to data analysis in GA4.
This guide distills the 12 most critical website KPIs you need to track in GA4 and contrasts them with KPIs for Universal Analytics. For marketing professionals, mastering these KPIs is essential for monitoring engagements, assessing compliance, and driving data-driven decisions.
Embracing GA4’s advanced analytics will equip you with the insights needed to navigate the digital domain effectively. As the July 1, 2024 deadline for switching to GA4 approaches, it’s imperative to prioritize these KPIs to stay ahead in the analytics game.
Contents
| GA4 KPIs | Universal Analytics KPIs |
| Users | Site Visitors (Sessions) |
| New Users | Unique Visitors (Users) |
| Sessions | Sessions |
| Engaged Sessions | Average Session Duration |
| Average Session Duration | Bounce Rate |
| Engaged Sessions per User | Acquisition/Traffic Sources |
| Bounce Rate | Pages per Session |
| Engagement Rate | Conversion Rate |
| Average Engagement Time | Goal/Event Completion |
| Views | Landing and Exit Pages |
| Event Count | |
| Landing Page |
Table 1: KPIs in GA4 vs Universal Analytic
GA4 Website KPIs
Experienced users of Universal Analytics will recognize many familiar features in GA4 — along with several notable changes. Currently, these are the 12 most important KPIs to track in GA4:
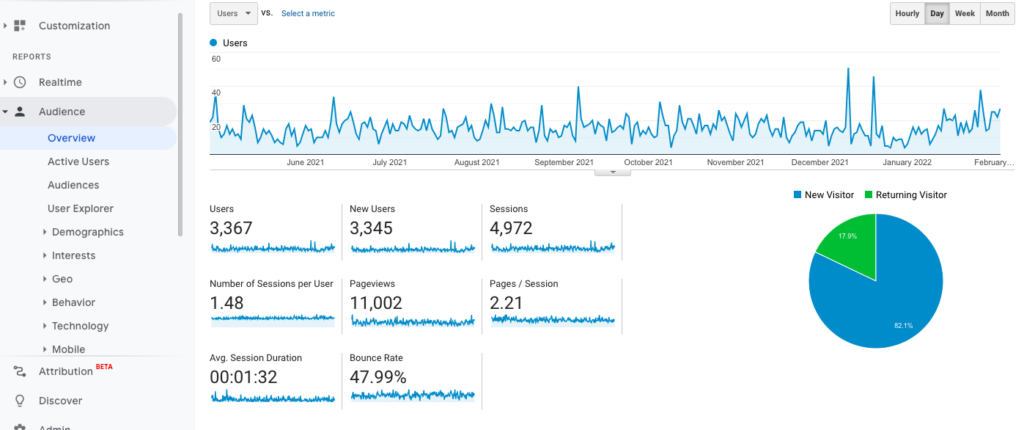
1. Users
Users in GA4 signifies the total count of unique visitors to a website, tracking both new and returning individuals. It is measured using unique user identifiers, which offer critical insights into the overall reach of a website, the scale of the audience, and the effectiveness of engagement strategies, essential for optimizing marketing efforts.
2. New Users
New Users identifies individuals visiting a website for the first time, a key metric for gauging the success of user acquisition strategies. GA4 measures this KPI by assigning unique identifiers to each new visitor, which is essential for marketers to understand the appeal of their website to potential audiences and the effectiveness of their outreach.
3. Sessions
Sessions in GA4 represent the individual interactions users have with a website over a given timeframe, such as page views or transactions. This KPI is critical for understanding how often users visit and engage with the site, informing businesses about the stickiness of their content and the overall user interest.
4. Engaged Sessions
Engaged Sessions measures the number of sessions where users show active engagement, such as by spending a certain amount of time on the site or interacting with the content. GA4 tracks this to provide insights into the depth of user interaction, which is valuable for assessing content quality and user engagement.
5. Average Session Duration
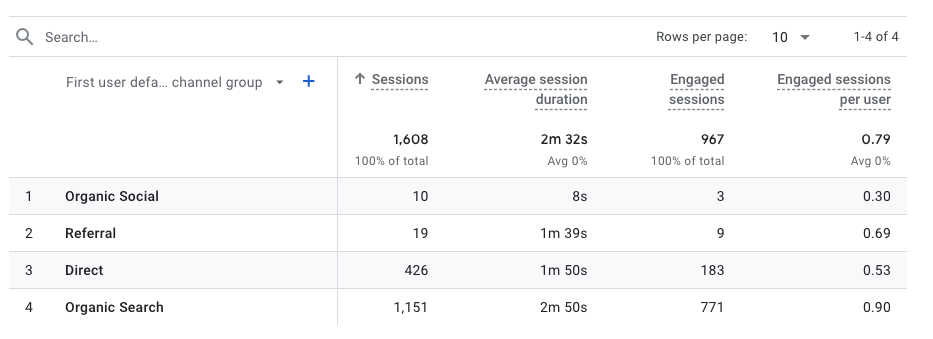
Average Session Duration reflects the average length of time spent in a session, providing insights into user engagement. GA4 calculates this by aggregating the duration of all sessions over a selected time period, offering valuable information on how compelling and informative users find the website content.
6. Engaged Sessions per User
Engaged Sessions per User averages the number of engaged sessions per individual user, providing a measure of repeat user engagement. GA4’s tracking of this KPI helps businesses understand how often users return and engage with the site, which is a key indicator of user loyalty and content value.
7. Bounce Rate
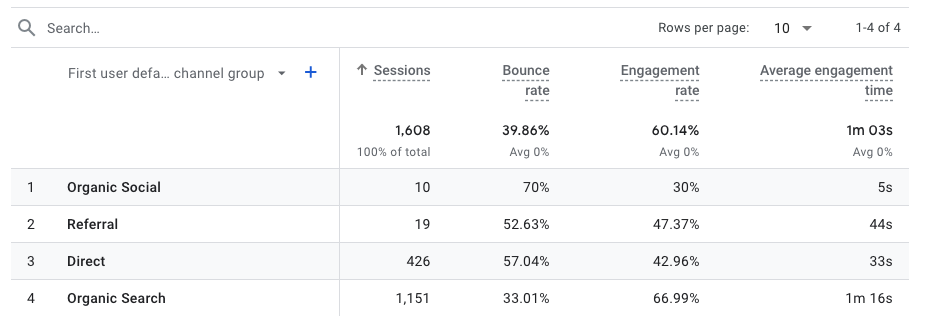
Bounce Rate in GA4 quantifies the percentage of sessions where users leave the site without interaction. By measuring bounce rate, businesses can assess the initial user engagement and effectiveness of their landing pages, which is instrumental for optimizing the user experience and retention.
8. Engagement Rate
Engagement Rate is the proportion of engaged sessions compared to total sessions. GA4 calculates this KPI to help businesses understand the level of active user interaction with their content, which is indicative of content relevance and user satisfaction with the site experience.
9. Average Engagement Time
Average Engagement Time indicates the average time users spend actively engaged with the content during a session. GA4 measures this KPI to give businesses insights into the effectiveness of their content in retaining user attention, which is crucial for content strategy and design.
10. Views
Views in GA4 are counted each time a user loads a page or screen, indicating the level of interest in specific content. By measuring the number of views, businesses can understand which pages are most popular and tailor their content strategy to increase user engagement and satisfaction.
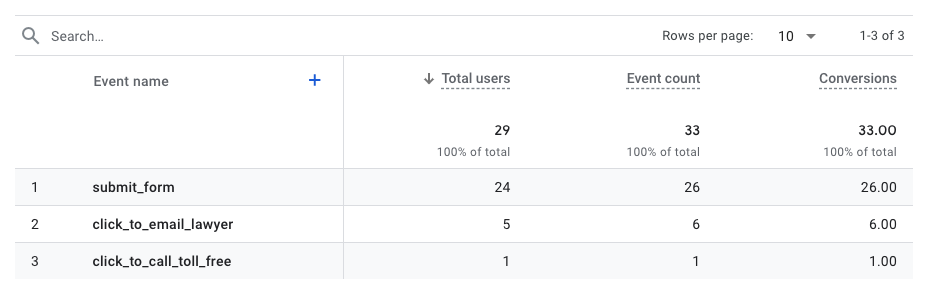
11. Event Count
Event Count aggregates the total number of user interactions classified as events in GA4, such as button clicks or form submissions. This KPI is crucial for evaluating the interactive elements of a website, offering insights into user behavior and the effectiveness of calls to action.
12. Landing Page
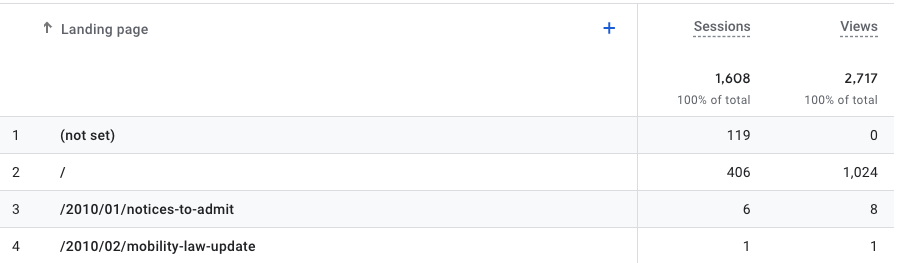
The Landing Page identifies the first page a user visits during a session, providing insights into the effectiveness of different entry points to a website. GA4’s tracking of this KPI helps businesses understand which pages serve as effective gateways, informing strategies for user acquisition and content placement.
Universal Analytics Website KPIs
For users still working with Universal Analytics, these 10 KPIs should remain the center of your tracking focus:
1. Site Visitors (Sessions)
Site Visitors are the quantity of traffic your website gets in each period. This will count external customers, internal users, and anyone working on your website. Site visits are an important KPI to monitor because they give you an idea of the reach of your website.
If you have a lot of site visitors, it means that people are finding your site and are interested in what you have to offer. If you have a low number of site visitors, it could mean that your site is not well-optimized for search engines or that you aren’t optimizing it for the right keywords and phrases that would drive traffic to your site.
It’s important to note that you’ll get a cleaner number if you exclude IP addresses for employees and web service personnel so that you’re mostly looking at current and potential customers.
2. Unique Visitors (Users)
Unique Visitors are all site visitors who have never been to your website before or who haven’t been to your website within a given time. This is important to track because you want to see how many new people are coming to your site and how often people are coming back. If you see a high number of unique visitors, it means that you’re reaching a lot of new people.
What sets a unique visitor apart from a site visitor is that a unique visitor indicates that a new person has visited your site. A site visitor can track multiple visits from the same person. While site visitors are a good measure of how many people are coming to your website (new and returning), unique visitors are a better way to track how many new visitors are finding and engaging with your site.
A simple way to break this concept down is to compare your site visitors to your unique visitors. If you have 10,000 site visits and 5,000 unique visitors, each visitor was on your site, on average, twice.
3. Sessions
A Session is the period of time a user is actively engaged with your website. A session begins when a user arrives at your site and ends when there are 30 minutes of inactivity. If a user leaves your site and comes back within 30 minutes, it will be counted as one session. If they leave and come back after 30 minutes have passed, it will be counted as two separate sessions.
This is an important metric to track because it tells you a lot about how your users engage with your site.
4. Average Session Duration
Average Session Duration is the average time a user spends on your site during a single session. This is different from sessions because sessions track the number of sessions in a given period, whereas average session duration tracks the average time per session.
The amount of time a user spends on your site can indicate how engaged they are with your site. For instance, if a user is spending most of their time on your site looking at product pages, then you know that they are likely interested in the products you sell.
However, if they are spending their time reading your blog content, then you know that they are likely looking for information to better educate themselves about your industry. Of course, if there is a mixed bag of product and content pages engaged during a session, you know your user is likely browsing your site to get to know your brand.
5. Bounce Rate
Consider looking at the Bounce Rate alongside your sessions and session durations. A bounce is when someone lands on your site and then leaves from that same page. This is a sign that though the ad or marketing efforts got them there, they weren’t engaged enough to stay.
The bounce rate is calculated as the percentage of people who land on your site and then leave from that same page. For instance, if you have a bounce rate of 20%, then that means that 20% of the people who landed on your site were not engaged enough to stay and interact with your site or content.
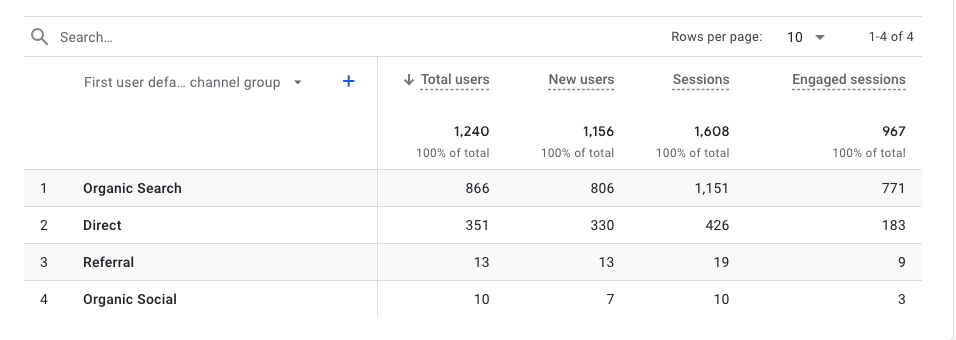
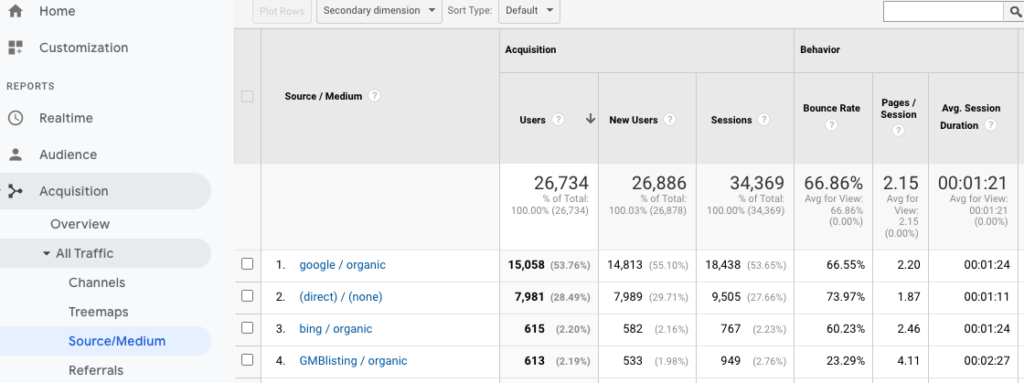
6. Acquisition/Traffic Sources
Acquisition/Traffic Sources give you an idea of how users are arriving at your site. You can find this data under the Acquisition tab on Google Analytics. The most common source of traffic is direct traffic, which is when a user types your URL into their browser or clicks on a bookmark. Other common sources of traffic include organic search, social media, email marketing, and paid advertising.
Taking a detailed look at your traffic sources can help you identify which marketing channels are performing the best among your target audience and which ones you either need to invest more in or eliminate.
7. Pages per Session
Pages per Session is a separate metric you can track on Google Analytics. It’s different from the previous metric because it shows you the average number of pages viewed during a single session. This metric can tell you a lot about how users are navigating your site and just how engaging your content is.
If you see that a user is spending a lot of time on a single page, then you know that the information on that page is likely very valuable to them. However, if you see that a user is bouncing around your site and not sticking around for long, you know that your content isn’t engaging them and that you need to improve it to give visitors a more satisfying experience.
8. Conversion Rate
Getting someone to come to your site is great, whether from organic traffic, a Google ad, or another marketing effort. However, you want to engage with them so they don’t bounce back out before a conversion is made. This is where Conversion Rates come in.
Conversion rate tells you what percentage of visitors convert from a visitor to engaged audience members. The higher the percentage of people who convert, the more successful your site is. You should also monitor how much your visitors are spending with you in dollars and cents when making their conversion. If you have a high conversion rate, but the dollar amounts are low, you can do better. Alternatively, a lower conversion rate with higher dollars may be just as good.
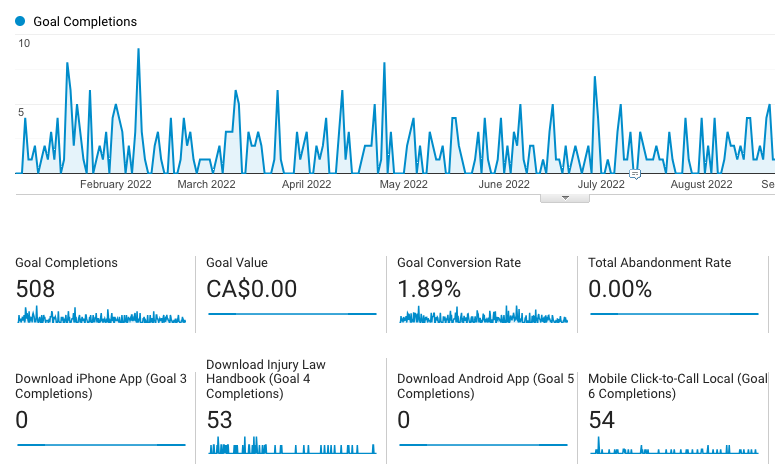
9. Goal/Event Completions
Goal/Event Completions can help you measure the effectiveness of your marketing and advertising efforts. You can use each of these website KPIs to track how users interact with your site.
Events are actions that users take on your site, such as clicking a button or video views. You can use events at the individual level to track visitor behaviors, which can help you collect valuable data not only on your website but also on your audience and their interests.
Goal completions are conversions that you want users to make, such as signing up for a newsletter or making a purchase. When someone lands on your site and completes a goal, you’ll be able to better measure how effective your marketing campaign and landing page content has been. For example, if you have a lead generation landing page that converts well, you can be certain that your email marketing (if that’s how they landed on the page) efforts are working well.
10. Top Landing Pages and Exit Pages
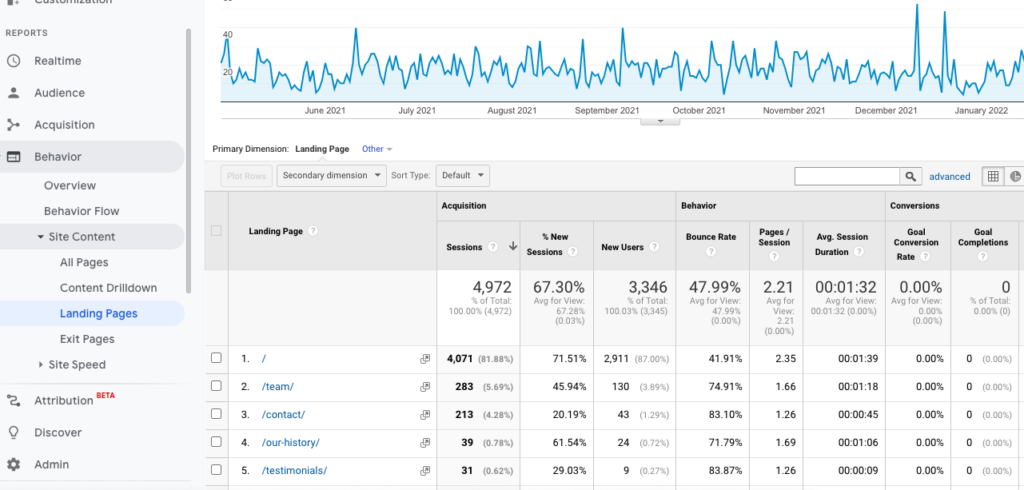
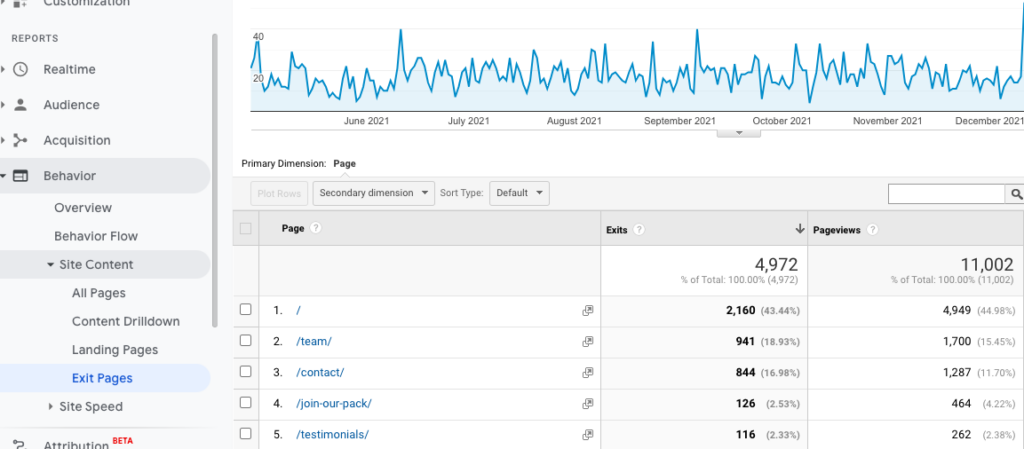
Finally, to measure the effectiveness of your landing page, you’ll want to make sure you’re tracking both the top Landing Pages and the Exit Pages.
The top landing pages in Google Analytics are the pages that receive the most traffic volume. Google Analytics uses several factors to determine which pages are the top landing pages, including the number of visitors, the number of page views, and the amount of time spent on the page.
The top exit pages in Google Analytics are the pages that have the highest rate of users exiting the site from that page. The exit rate is determined by the number of people who leave that page divided by the total number of people who viewed that page. The exit rate is important because it can help you identify which pages are losing your users’ attention and which pages need improvement.
Both of these performance metrics play a crucial role in determining the success of your landing pages, and when it comes time for website maintenance, you’ll know exactly where to focus your efforts.
Top Website KPIs for Different Types of Sites
The right website metrics are crucial to understanding how your content is performing. However, if you’re a small business owner or marketing manager, you may not have the time or the resources to maintain a detailed analysis of your site’s performance. That’s why it’s important to focus on the right website KPIs. Here are the top website KPIs for a few different types of sites.
Top KPIs for Blogs
A blog is typically a website run by an individual or a small group of people that regularly posts articles, usually on a specific topic. The intention of a blog is usually to share information or opinions, though some blogs are simply used as a platform to sell products or services. The most important website KPIs for a blog are usually measures of engagement, such as:
- Bounce rate
- Average session duration
- Average pages per session
- New/returning visitors
- Conversation rate
- Click-through rate
- Traffic sources
Top KPIs for Ecommerce Sites
Ecommerce sites are websites that sell products or services online. Ecommerce sites are different from other types of websites because they have a transaction-based goal. The most important website KPIs for an ecommerce site are measures of conversion, such as:
- Event completions
- Total number of conversions
- conversation rate
- Traffic sources
- Sessions
- Bounce rate
- Abandonment rate
Top KPIs for Google Ads
Google Ads is a form of online advertising platform created by Google that allows businesses to display ads on Google Search, YouTube, and other websites. With Google Ads, you can set a budget for an advertising campaign and only pay when someone clicks on the ad you created. The most important website KPIs for a Google Ads campaign are measures of both engagement and conversion, such as:
- Conversions
- Clicks
- Click-through rate
- Average cost per click
- Impressions
- Bound rate
- Top landing pages
- Top exit pages
Make the Most of Your Website with Fingerprint Marketing
As you can see, there is a variety of website KPIs that you can track with Google Analytics to help you make the most of your website. However, remember that not all KPIs are equally important for all businesses. You should focus on the KPIs that are most important for your business goals.
Before you can decide which KPIs are most important for your business, you need to set some marketing goals for your website. What do you want your website to achieve? Do you want to increase sales, generate leads, or build brand awareness? Once you have set your goals, you can decide which KPIs will help you achieve them.
Here at Fingerprint Marketing, we help our clients increase their website traffic and engage their target audience base by taking a holistic view of their website and helping them focus on their specific goals and how they can achieve them.
If you’re not sure how to get started tracking KPIs on your website or which KPIs will be most informative for your business and marketing model, contact Fingerprint Marketing for a free consultation on making your website the best it can be.
Join over 5,000 Marketing Minute subscribers who receive weekly videos and tips on how to step up your marketing game.